Risk Management in the Portal
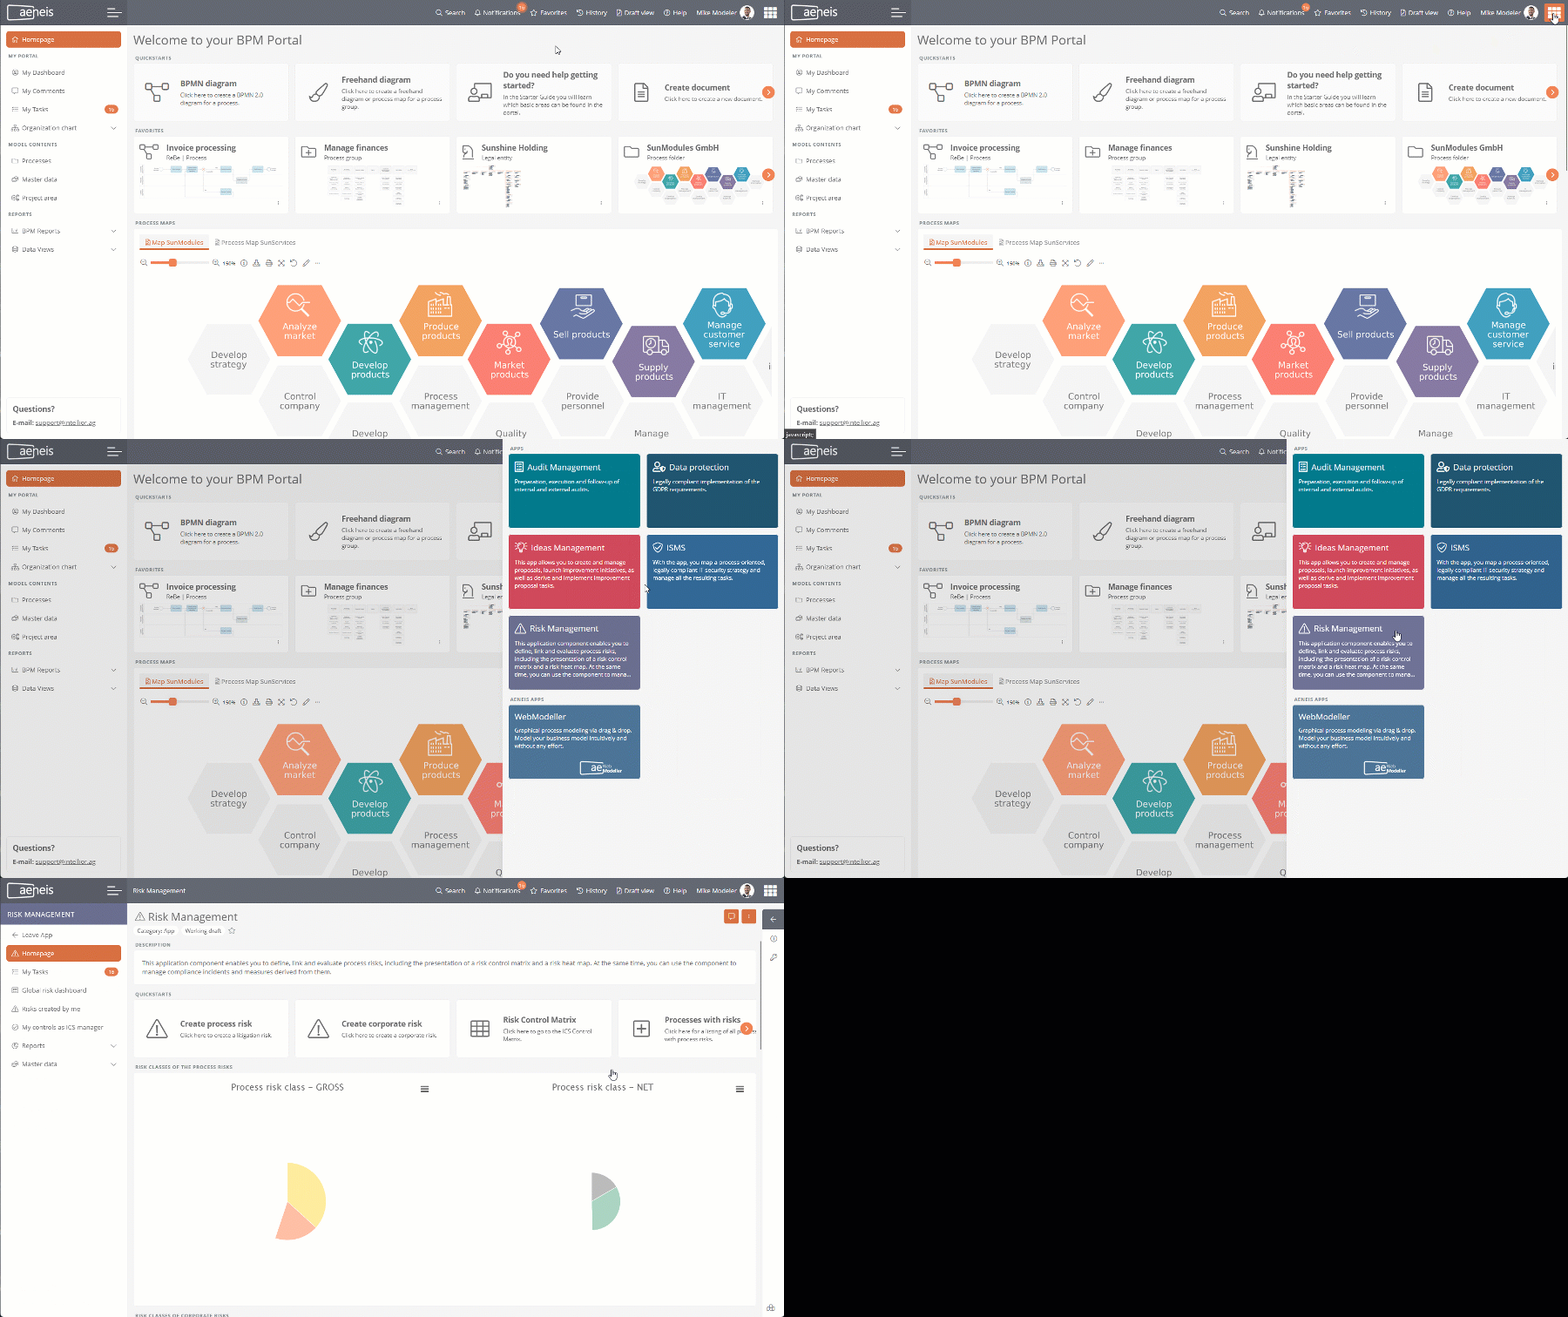
The Risk Management in the Portal is configured in a separate app. In the Risk Management app, there is a homepage and multiple dashboards and reports that allow you to monitor and manage all relevant risks, controls, and tasks.
Open the Risk Management app:

Homepage
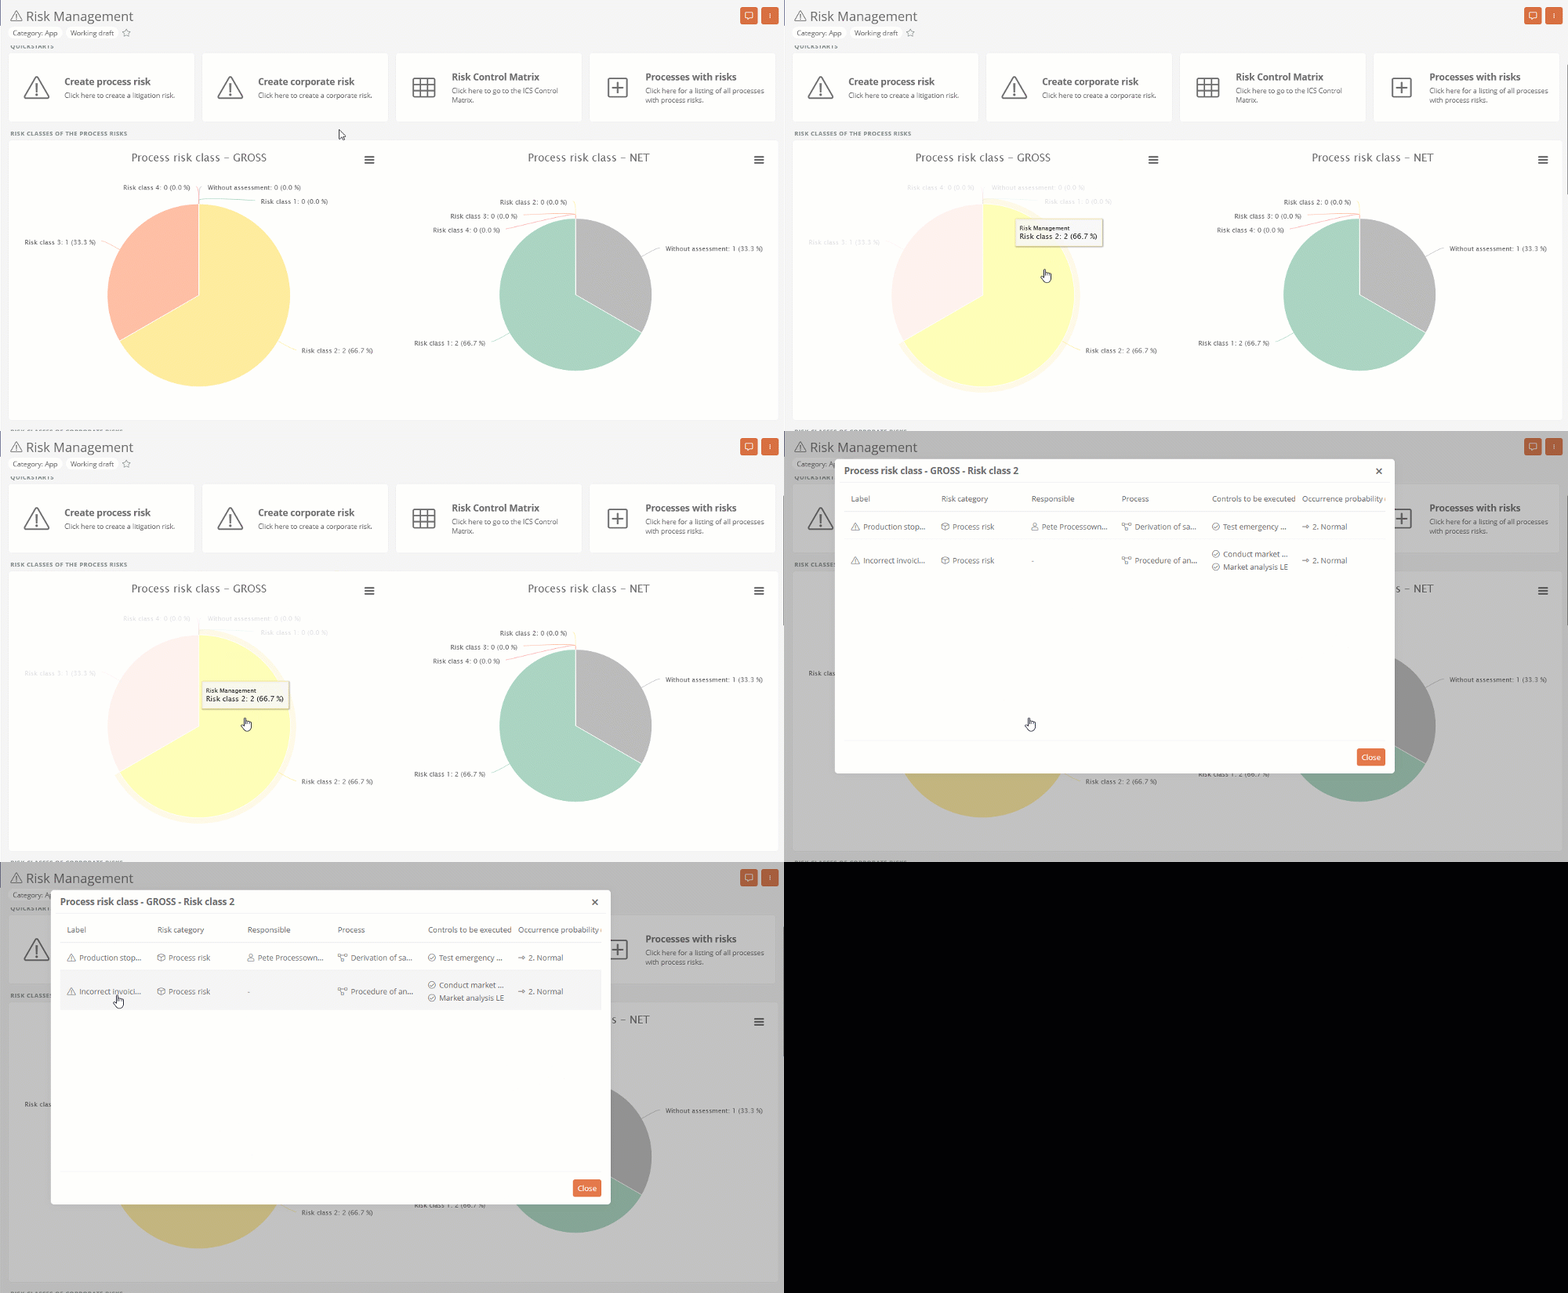
The homepage in the Risk Management app shows you the main quickstarts and overviews. You can use the quickstarts to create new risks, navigate to the risk control matrix or to an overview of all processes with risks.
Note: The homepage displays only the content that is relevant to you and that you have access to.
The pie charts evaluate the risk classes of process and corporate risks. Clicking on a value in the pie chart opens the entire list, from where you can navigate directly to the risk.

Risk matrix
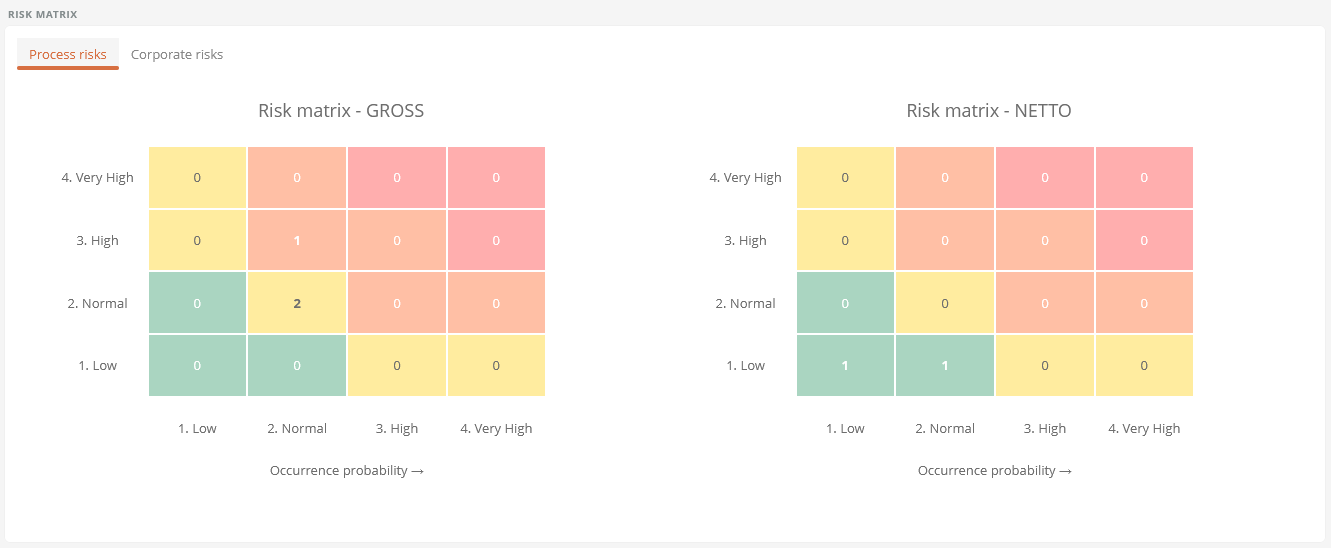
The risk matrix shows the assessment of risks and the amount of assessed risks. Using the tabs in this area, you can view the risk matrices of the net and gross assessments of the process risks or the corporate risks, respectively. The different colors indicate the severity of the impact and the level of probability of occurrence.

-
The green area shows the number of risks whose probability of occurrence and impact are low.
-
The yellow area shows the number of risks whose probability of occurrence and impact are normal or somewhat increased.
-
The orange area shows the number of risks whose probability of occurrence and impact are high.
-
The red area shows the number of risks whose probability of occurrence and impact are very high.
Example: If three risks have a normal probability of occurrence and a high impact, a three is output in the corresponding cell in the matrix.
Risks and risk classes for which I am responsible
The bottom section on the homepage shows which risks you are responsible for and how they are rated. Pie charts evaluate the risk classes of the risks for which you are responsible. In the table below, all risks for which you are responsible are listed. Using the drop-down menu in the table header, you can select which columns should be output in the table.
See also: Risk Dashboard - Risks created by me
Risk Control Matrix
The risk control matrix lists all objects that belong to or are related to the Risk Management. In the matrix, all objects and their references to each other are output in the columns. The matrix can be adjusted via the column selection and via the filters so that only the objects that are currently relevant are displayed.
